FCLT Compass now reflects 15 years of data, examining global wealth and investment horizon shifts since 2009. In addition to answering the question, “Are capital markets becoming more long-term or short-term?” this project draws the connection between investment horizons, global participation in capital markets, and the health of household savings, demonstrating the power of long-term investing.
The disconnect between global wealth accumulation and time horizons in this period highlights an underlying tension: while resources have grown, the patience to invest for the long term has diminished.
Investment horizons remain misaligned:
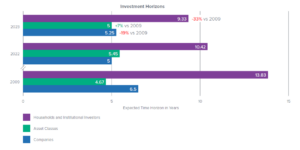
2023 saw macroeconomic conditions that shortened investment horizons for savers and asset classes and slightly lengthened for companies; however, the gaps between asset classes, companies, and savers’ horizons persist.
![]()
Over the past decade, the emergence of index funds has driven a 7% increase in average asset class horizons. However, 2023 marked a notable reversal, as horizons decreased by 8%. Rising interest rates, which reduced fixed-income durations and increased turnover in the active equities market, contributed to this decline.
In that same timeframe, corporate investment horizons shortened by 9%, largely due to lower CapEx and increased allocation to dividends and buybacks. In 2023, there was a slight reversal in these trends: Buybacks became a less attractive use of capital, coinciding with more spending on R&D, resulting in a 5% increase in corporate horizons year-over-year.
Since 2009, household investment horizons have decreased by 35%, with savers shifting more towards cash and short-term equity. Meanwhile, institutional investors have extended their horizons by 9%, shifting towards private equity, real estate, and infrastructure, reflecting a strategy focused on growth and resilience.
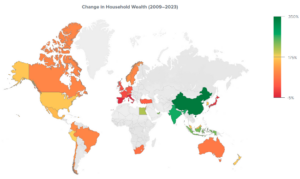
Global household wealth has more than doubled over the past decade, but investment horizons are not getting longer:
Regions with lower levels of market participation see fewer individuals benefiting from the growth opportunities that capital markets can provide. When only a small segment of households invests in financial markets, the advantages of compounding returns and wealth accumulation remain out of reach for most.
![]()
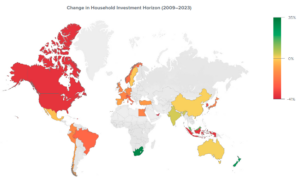
Household investment horizons are shorter in the Middle East, Africa, and East Asia due to lower overall market participation, especially compared to the Americas and Europe. Even though wealth has increased significantly in these markets (household wealth has more than doubled over the past decade globally), investment horizons are not getting longer.
Examining the countries with the highest and lowest levels of capital market participation reveals the relationship between capital market participation and economic development.
- Sweden, with a GDP per capita of USD 55,430 in 2023, leads all countries in our study in terms of capital market participation.
- In contrast, South Africa, with a GDP per capita of USD 6,1108, has one of the lowest participation rates.
This disparity underscores the importance of financial resources as a pathway to accessing the benefits of capital markets.
Market participation drives economic mobility – but is easier said than done:
Broader capital market participation is critical to unlocking economic mobility, securing retirement, and extending investment horizons, but it remains a luxury that primarily benefits those who can afford it.
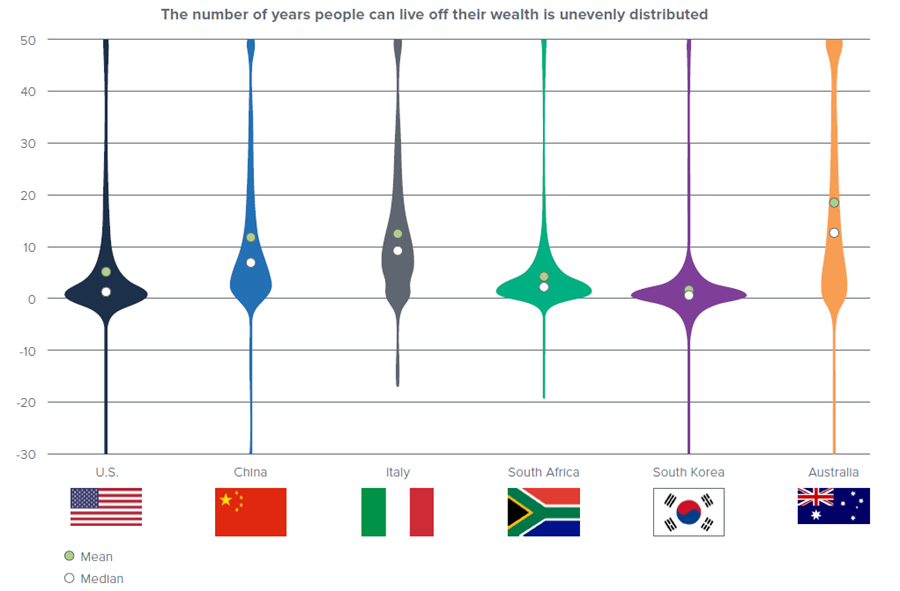
Even in the wealthiest countries, significant portions of the population have insufficient savings. The average household in our study can only live off its current savings for less than five years.
- Notably, households in the U.S. and China, the two largest economies in the world, have a median of approximately one year and 6 years of savings, respectively.
- Conversely, mandated participation in the Australian retirement system has resulted in a median of 12 years of savings.
To learn more, explore the FCLT Compass dashboard and read the 2024 report:
FCLT Compass Dashboard
FCLT Compass 2024 Report![]()


