View the FCLTCompass 2021 Dashboard
The theme of FCLTCompass 2021 is divergence – there was not one unified approach to withstanding the effects of COVID-19, and strategies and capital allocation decisions varied between companies and investors and between national economies. In the face of volatility, companies are committing to the long term, while investors appear headed in the opposite direction. But investors – or savers more broadly – are anything but homogeneous.
Key findings include:
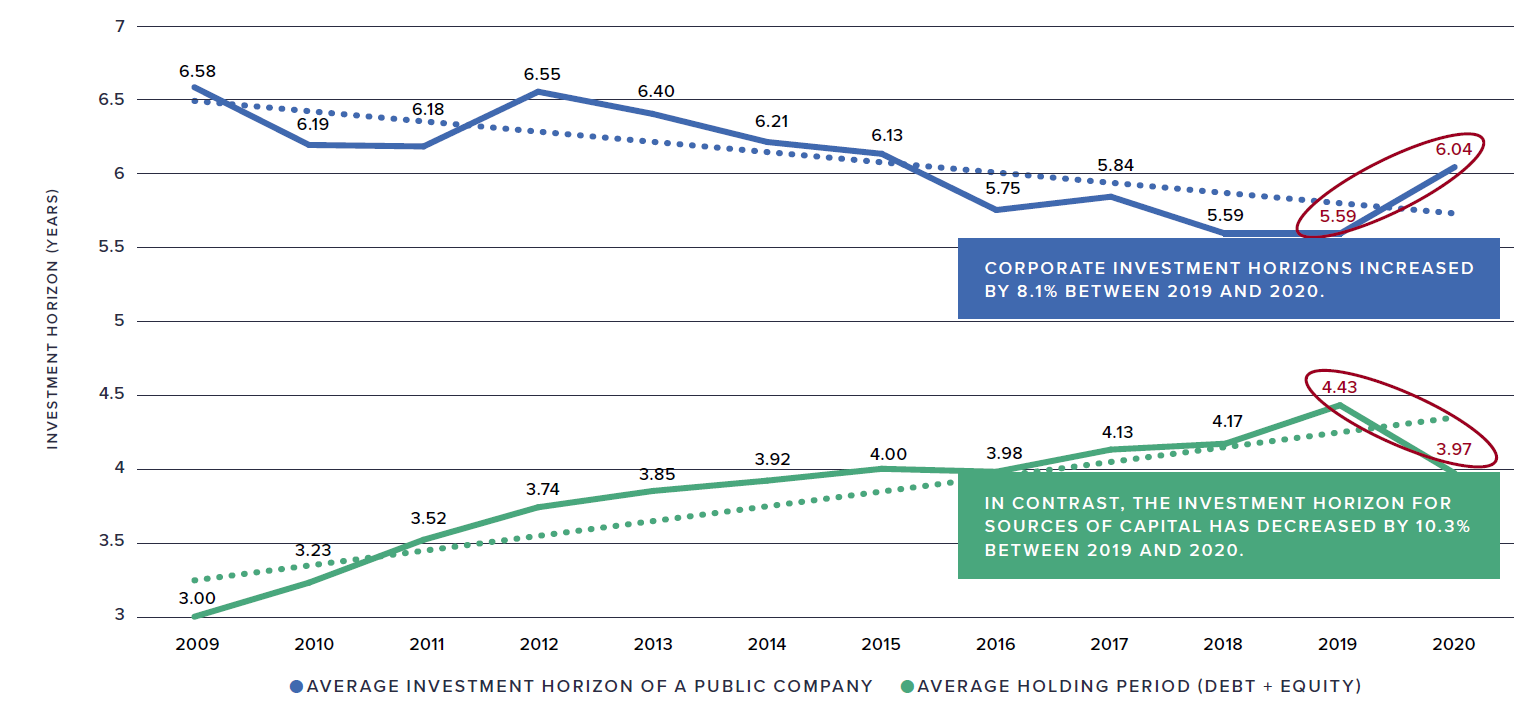
- Corporate time horizons lengthened by 8.1 percent globally, driven by curtailed distribution of capital to shareholders and increased investment in the business via research and development (R&D) and growth of fixed asset investment.
- Corporate funding-investment gaps widened by 11 months as the time horizons of corporate sources of funding fell by 10.3 percent (six months).
- The time horizons of investor allocations shortened by 2.3 percent on average, driving investors’ intention-allocation gap up by 2 months (to seven years, four months).
- Household wealth grew by 9.1 percent from 2019 to 2020, but the growth in savings was not evenly distributed and skewed toward wealthier households.
- Inequality grew even more than savings, with the Gini score (a measure of the degree of inequality in the distribution of income and wealth) jumping to its highest level since 2014, erasing years of improvement in global wealth inequality.
When faced with the startlingly sudden COVID-19 shutdown of the global economy in just a few short weeks, many companies opted to focus on the long term. And they did that in the face of debt and public equity holding periods that fell by over 10 percent in the same period, contributing to a widening of the gap – by more than two years – between the time horizons of corporate sources of capital and corporate uses of capital.

In a survey of FCLTGlobal Member organizations that collected responses during April 2020, we found that 73 percent were using planning horizons of three or more years and 50 percent cited “commitment to long-term strategy” as most important to successfully steering their organizations through the COVID-19 pandemic. This commitment was borne out in the data: corporate investment horizons lengthened by more than 10 percent from 2019 to 2020.
The longer investment time horizons at companies came despite a buildup of cash on the balance sheet – a trend that usually shortens corporate average horizons, as cash is considered to have a time horizon of zero. That cash buildup came in part from a decline in the return of capital to shareholders (via buybacks and dividends), which was voluntary in some cases and mandated by regulators in others. In either case, the effect provided the raw capital to fuel growth investments.
So, what did companies spend their capital on? Investment in R&D jumped to levels not seen in the past two decades – 10.9 percent of total spending. And that spending was broad-based across industries, not just driven by the healthcare and pharmaceutical industries racing to treat patients and develop COVID-19 vaccines.
Similarly, investment in fixed assets (capital expenditures) climbed to 29 percent of total spending as companies brought their supply chains in-house and enhanced mission-critical infrastructure. This fixed investment too was widespread and not concentrated in any one particular industry or geography. In a world that had been moving toward multinational globalization, the pandemic response appears to have led many companies to reconsider their supply chains and reinvest in domestic production. If it persists, this shift could reverse the trend toward fixed-asset-light business models we saw in the prior decade – a trend that previously contributed to shrinking corporate balance sheets and investment time horizons.
Investors’ response to economic and market uncertainty was quite different. On a global scale, investors’ time horizons shortened for investors, the shortening horizons in fixed income and public equities obscure the quite different reactions of savers around the world over the past year. Some favored cash and equities, while others pulled money from the markets and prioritized more tangible real estate investments as a safe haven. On balance, these responses resulted in a decline of 2.3 percent in the average investment time horizons of savers, a trend that should reverse as global markets stabilize and the impact of the pandemic wanes.
Many of the meaningful shifts we see in allocations and investment time horizons are likely due to market volatility as a result of the pandemic, and the associated changes in market valuations, rather than a true change in strategy. Unprecedented government intervention in reaction to the global economic shock was a key factor in this year’s data. How that intervention plays out over time will have important long-term implications for the investment horizons of capital market participants.
Our goal for this project is to further contribute to our ongoing practical research to help companies, investors, and savers alike practice long-term decision-making as the norm, not the exception. We welcome your comments and suggestions as we continue our work to focus capital on the long term to support a sustainable and prosperous economy.


