Markets are most efficient when the investment horizons — the length of time a security, portfolio, or other asset is held — of savers, investment organizations, and companies are aligned. This chart assigns year-based horizons to each, allowing for a direct comparison between their investment and capital allocation outlooks.
The weighted averages of the intended timeframes required for investments to be recouped, come to fruition, or meet an end goal, based on various expenses or allocations, in years. Please read the latest FCLTCompass report to learn more about how we calculate specific investment horizons.
Market participation improves long-term financial stability. This chart indicates how households allocate their savings globally and how many are growing their savings via capital markets.
The percentage of households that invest some portion of their money in capital markets, and the percentages of total household savings allocated to cash, capital markets investments (e.g., equity, mutual funds, pensions, life insurance), or real estate measured on a national basis1,2,3,4.
Sweden
65%
Denmark
58%
United States
57%
Australia
51%
Switzerland
44%
Belgium
36%
Chile
34%
Canada
33%
France
32%
Germany
30%
Japan
30%
Greater China
26%
United Kingdom
23%
Norway
21%
Netherlands
20%
New Zealand
20%
Austria
18%
Portugal
15%
Spain
12%
Italy
10%
Singapore
8%
Indonesia
7%
Russia
6%
India
3%
Turkey
1%
Brazil
1%
South Africa
1%
Metric | Allocation |
---|---|
Market Participation by Household | 18% |
Metric | Allocation |
---|---|
Market Participation by Household | 51% |
Cash Allocation | 9% |
Capital Markets Allocation | 29% |
Real Estate Allocation | 61% |
Metric | Allocation |
---|---|
Market Participation by Household | 36% |
Metric | Allocation |
---|---|
Market Participation by Household | 1% |
Cash Allocation | 10% |
Capital Markets Allocation | 43% |
Real Estate Allocation | 47% |
Metric | Allocation |
---|---|
Market Participation by Household | 33% |
Cash Allocation | 16% |
Capital Markets Allocation | 38% |
Real Estate Allocation | 46% |
Metric | Allocation |
---|---|
Market Participation by Household | 44% |
Cash Allocation | 17% |
Capital Markets Allocation | 37% |
Real Estate Allocation | 46% |
Metric | Allocation |
---|---|
Market Participation by Household | 34% |
Cash Allocation | 10% |
Capital Markets Allocation | 45% |
Real Estate Allocation | 45% |
Metric | Allocation |
---|---|
Market Participation by Household | 26% |
Cash Allocation | 35% |
Capital Markets Allocation | 12% |
Real Estate Allocation | 53% |
Metric | Allocation |
---|---|
Market Participation by Household | 30% |
Cash Allocation | 16% |
Capital Markets Allocation | 23% |
Real Estate Allocation | 61% |
Metric | Allocation |
---|---|
Market Participation by Household | 58% |
Metric | Allocation |
---|---|
Market Participation by Household | 12% |
Cash Allocation | 12% |
Capital Markets Allocation | 19% |
Real Estate Allocation | 69% |
Metric | Allocation |
---|---|
Market Participation by Household | 32% |
Cash Allocation | 13% |
Capital Markets Allocation | 25% |
Real Estate Allocation | 63% |
Metric | Allocation |
---|---|
Market Participation by Household | 23% |
Cash Allocation | 15% |
Capital Markets Allocation | 33% |
Real Estate Allocation | 52% |
Metric | Allocation |
---|---|
Market Participation by Household | 7% |
Cash Allocation | 26% |
Capital Markets Allocation | 11% |
Real Estate Allocation | 62% |
Metric | Allocation |
---|---|
Market Participation by Household | 3% |
Cash Allocation | 11% |
Capital Markets Allocation | 10% |
Real Estate Allocation | 79% |
Metric | Allocation |
---|---|
Market Participation by Household | 10% |
Cash Allocation | 14% |
Capital Markets Allocation | 29% |
Real Estate Allocation | 57% |
Metric | Allocation |
---|---|
Market Participation by Household | 30% |
Cash Allocation | 34% |
Capital Markets Allocation | 26% |
Real Estate Allocation | 40% |
Metric | Allocation |
---|---|
Market Participation by Household | 20% |
Cash Allocation | 10% |
Capital Markets Allocation | 37% |
Real Estate Allocation | 52% |
Metric | Allocation |
---|---|
Market Participation by Household | 20% |
Cash Allocation | 43% |
Capital Markets Allocation | 16% |
Real Estate Allocation | 41% |
Metric | Allocation |
---|---|
Market Participation by Household | 21% |
Cash Allocation | 9% |
Capital Markets Allocation | 21% |
Real Estate Allocation | 70% |
Metric | Allocation |
---|---|
Market Participation by Household | 15% |
Metric | Allocation |
---|---|
Market Participation by Household | 6% |
Metric | Allocation |
---|---|
Market Participation by Household | 65% |
Cash Allocation | 9% |
Capital Markets Allocation | 53% |
Real Estate Allocation | 38% |
Metric | Allocation |
---|---|
Market Participation by Household | 8% |
Cash Allocation | 20% |
Capital Markets Allocation | 37% |
Real Estate Allocation | 44% |
Metric | Allocation |
---|---|
Market Participation by Household | 1% |
Cash Allocation | 15% |
Capital Markets Allocation | 7% |
Real Estate Allocation | 77% |
Metric | Allocation |
---|---|
Market Participation by Household | 57% |
Cash Allocation | 8% |
Capital Markets Allocation | 59% |
Real Estate Allocation | 32% |
Metric | Allocation |
---|---|
Market Participation by Household | 1% |
Cash Allocation | 17% |
Capital Markets Allocation | 52% |
Real Estate Allocation | 31% |
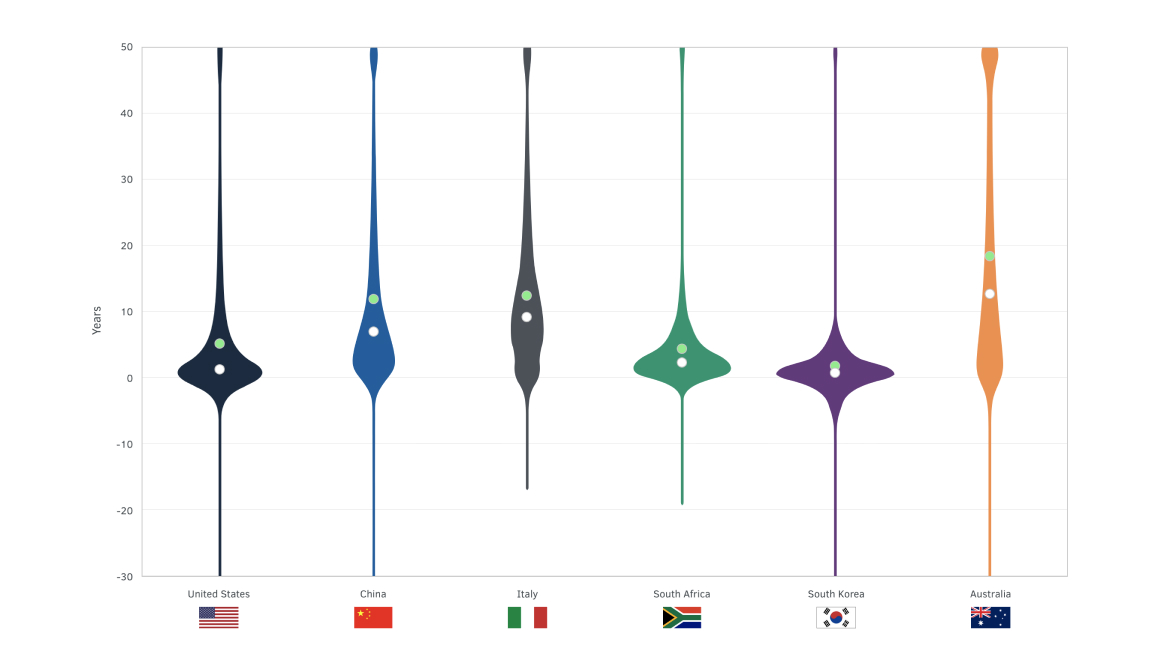
Millions of people worldwide are saving money to meet personal financial goals, namely funding a comfortable retirement. This chart indicates how long people in certain countries can live off their current savings5.
The number of years households in various countries can sustain themselves with their current net wealth given their current level of annual expenditures. The vertical axis represents the range of years households can sustain themselves; values below zero indicate households in debt. The horizontal axis indicates the concentration of households at a given year. Extreme values truncated at -30 and 50 for illustrative purposes.
Years
1 “The Global Wealth Report 2024,” UBS group, 2024.
2 “The World Factbook,” CIA, accessed October 2024..
3 Household Financial Assets,” OECD, accessed July 2024.
4 See, e.g. “What drives stock market participation? The role of institutional, traditional, and behavioral factors — Wave 5.” For a complete list of capital market participation data, contact [email protected].
5 KLIPS, SHIW, HILDA, PSID, SCF, NIDS, CHFS
Article
10 November 2021 - Corporate R&D spending increased significantly during the pandemic, setting the stage for a future boom in innovation and value creation. Is this a sign of the winners just pulling ahead of the rest?
In the News
7 December 2021 - Long- and short-term expectations aren’t what they used to be, from corporate decisions to the fidgets in equities. And you’ll need to rethink sovereign wealth funds.
Climate | Article
24 November 2021 - Will shorter holding periods have an impact on climate change efforts?