
The corporate community is getting shorter-term in how they allocate capital to support their business. Is this a cause for concern?
The corporate community is getting shorter-term in how they allocate capital to support their business. Is this a cause for concern?
There is ample evidence that taking a long-term approach delivers superior value for companies over time. From 2001 to 2014, the revenue of long-term firms cumulatively grew, on average, 47 percent more than the revenue of other firms, with less volatility, and added nearly 12,000 more jobs on average than other firms over that same timeframe. Long-term-oriented companies bounce back quicker from a downturn and create 9 percent more return on their invested capital, too.
Despite the many benefits of taking a longer-term approach to business, corporate investment time horizons are declining. The lifespan of companies’ investments worldwide dropped by about a year, on average over the past decade. Simply put, the corporate community is getting shorter-term in how they allocate capital to support their business. Is this a cause for concern?
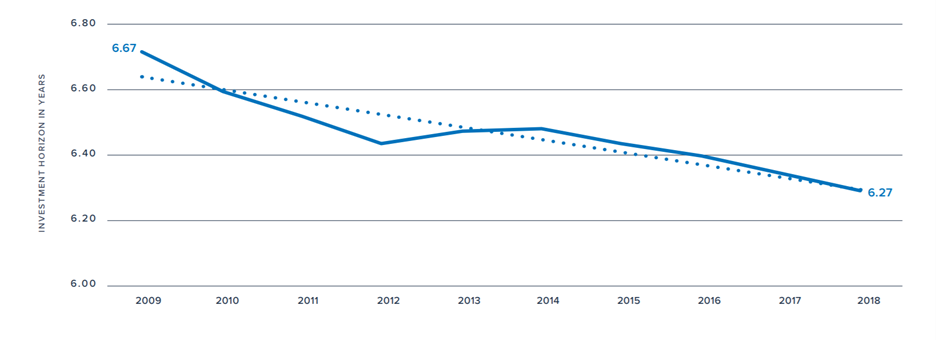
FCLTCompass, a new study from FCLTGlobal, measures investment time horizons among the major players in global capital markets – savers, companies, and investors – and gauges whether their interests are aligned. The data, covering global corporate and investor data from 2009 to 2018, shows that markets are largely out of sync with the savers and companies that use it for invest and grow their capital. It also reveals a 14.1 percent decline in the average public company investment horizon – from six years, six months in 2009 to five years, seven months in 2018. Without any context, shortening corporate investment horizons would raise red flags. But when viewed against the changing global business landscape, this drop may not necessarily imply bad behavior.
Companies’ investment horizons often match the average life of the assets in which they invest. Items that make up a corporate investment portfolio, such as patents, machinery, and software, all have “average useful lives”. Attaching a precise timeframe to these various pieces can help to compare the intended timeframes of the assets that comprise a company’s sources of capital – active and indexed equity – with the company’s own goals.
Companies in 2020 are spending to meet the needs of a modern, tech-reliant, and increasingly remote business. The evolution of companies toward fixed asset–light business models naturally contributes to such a decline by changing the composition, and average useful life, of a company’s assets. A withdrawal from traditional capex spending toward acquisitions, dividends, and buybacks shifts the profile of the average company’s investment portfolio.
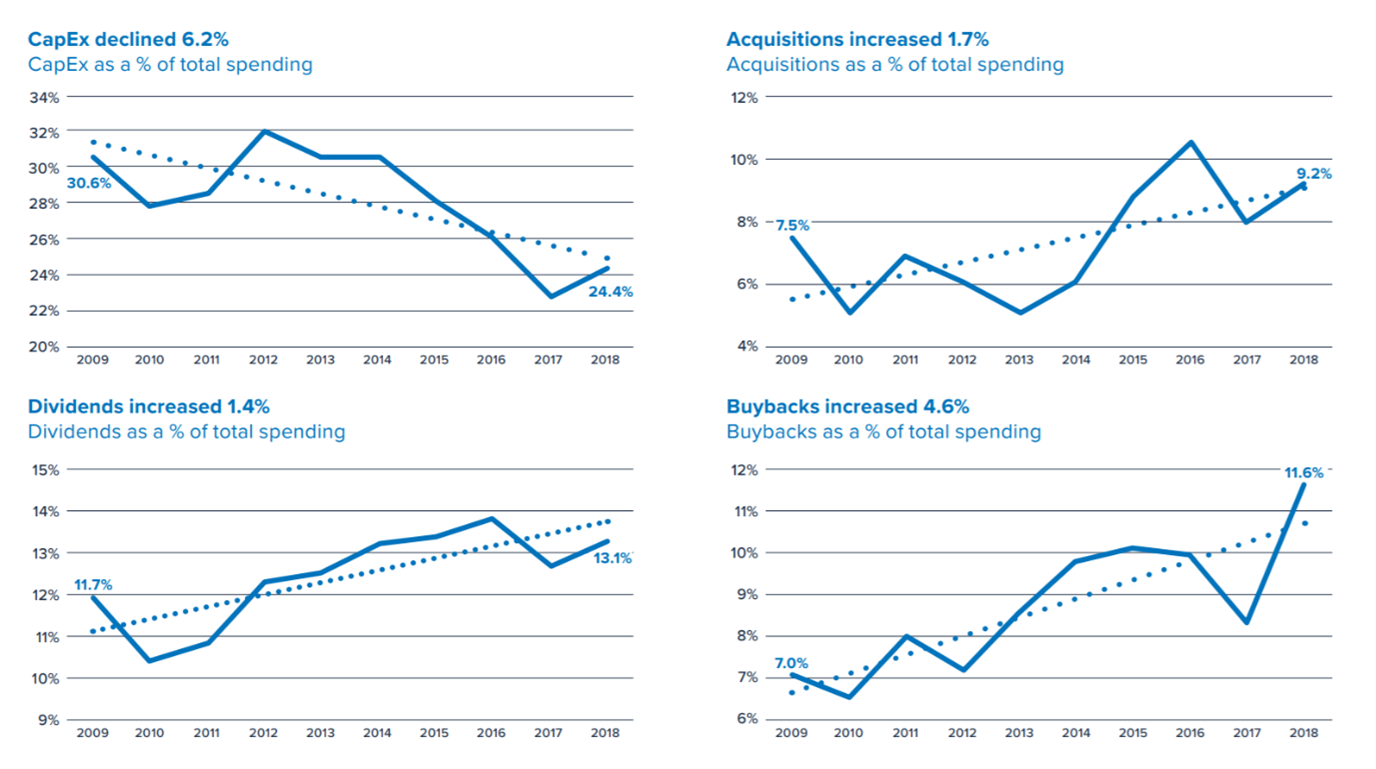 Source: FCLTCompass 2020 Report
Alongside the shift to a fixed asset-light business model, R&D spending has seen meaningful change in the past decade. From 2009 to 2018, R&D as a percentage of total spending increased by 1.3 percent, but the timeframe of that spend declined slightly (shorter by five months). This pattern suggests that on balance, new investment in R&D is flowing toward near-term projects, contributing to the broader decline in corporate investment horizons.
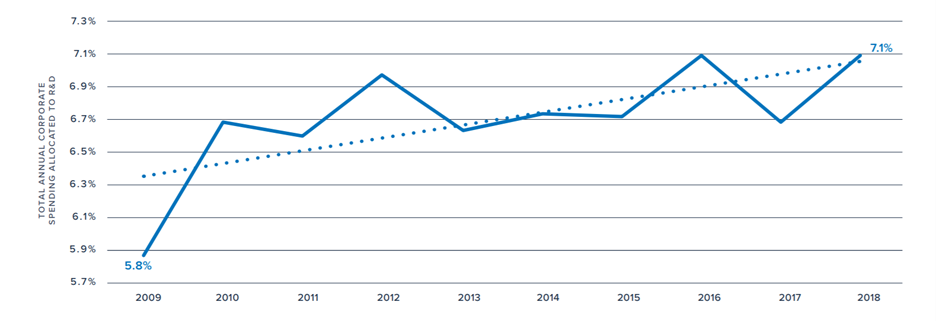
Source: FCLTCompass 2020 Report
Source: FCLTCompass 2020 Report
One cause for concern in this regard, though, is debt – companies have more debt outstanding than ever before. Issuance from the constituents of the MSCI (ACWI) increased by $10 trillion from 2009 to 2018. The fact that debt has increased is not alarming in of itself when considering the relatively low rate environment, but the maturity of that debt is declining and is coupled with the aforementioned rise in buybacks. Companies may act in the belief that they can earn more in buying back their own stock than what they’ve borrowed, but excess leverage may pose serious risks to corporate resilience.
This new focus on technology and intangible assets has drastically altered how companies operate today and provides further explanation for the gradual shortening of investment timelines. It is timely, then, that many businesses and investors are clamoring for a better way to report on intangible investment. In a fixed-asset-light world, financial accounting standards will inevitably evolve to better reflect the new realities of corporate spending.
Being “long-term” is often defined by a long list of factors – industry, geography, corporate structure, and maturity of the business – and the business cycle of a company will often differ from peers. While an overall drop in corporate investment horizons isn’t something to celebrate, it is not a cause for alarm just yet. As companies adapt to doing business in 2020 and beyond, the way that they spend their money will change – less on property and equipment, and more on human capital, new technologies, and intellectual property. This provides new framing to the conversation around sustainable business and presents today’s companies with new ways to meet near-term demands and reach long-term goals.
18 December 2024 - FCLT Compass is a dashboard measuring the investment horizons of the global investment value chain, how households are saving and allocating their money, and how long they can live off those savings. Calculating these metrics provides a holistic understanding of the long- or short-term orientation of global capital markets and how that orientation impacts the financial futures of millions of people worldwide.

Risk and Resilience | Article
25 January 2021 - In a decade-long low interest rate environment, riskier asset classes have seen accelerated asset gathering as savers chase yield.

Podcast
11 January 2021 - Our first episode of 2021 introduces FCLTCompass, our new dashboard tracking long-term investments on a global scale. Listen to a special replay of our launch event, held on 10 December 2020, to learn more about the dashboard and its important findings. For more information, click here. This episode is also available on Apple, Spotify, and YouTube. To learn more, visit the homepage for Going Long with FCLTGlobal.